link: http://onlinepubs.trb.org/onlinepubs/nchrp/cd-22/v2chapter5.html
Postulate mathematical models from theory and past research.
Discrete
choice models (logit, nested logit, and probit) are used to develop
models of behavioral choice or of event classification. It is accepted a priori that the analyst doesn’t know the complexity of the underlying relationships, and that any model of reality will be wrong to some degree. Choice models estimated will reflect the a priori
assumptions of the modeler as to what factors affect the decision
process. Common applications of discrete choice models include choice of
transportation mode, choice of travel destination choice, and choice of
vehicle purchase decisions. There are many potential applications of
discrete choice models, including choice of residential location, choice
of business location, and transportation project contractor selection.
//Các Mô hình lựa chọn phân biệt thường được sử dụng để phát triển các mô hình lựa chọn hay các nhóm vấn đề - sự kiện. Các mô hình này chấp nhận một giả định theo nguyên lý của các nhà phân tích như các nhân tố ảnh hưởng đến quá trình quyết đinh. ví như các mô hình phân tích lựa chọn : tàu - xe, địa điểm du lịch, quyết định lựa chọn mua xe nào...Các rất nhiều ứng dụng của mô hình lựa chọn phân biệt bao gồm cả vấn đề lựa chọn địa điểm sinh sống hay nơi kinh doanh....
In
order to postulate meaningful choice models, the modeler should review
past literature regarding the choice context and identify factors with
potential to affect the decision making process. These factors should
drive the data-collection process—usually a survey instrument given to
experimental units, to collect the information relevant in the decision
making process. There is much written about survey design and data
collection, and these sources should be consulted for detailed
discussions of this complex and critical aspect of choice modeling.
//Để đạt được giả định đầy đủ tính ý nghĩa của mô hình lựa chọn, các nhà nghiên cứu phải review các nghiên cứu đi trước, biểu cảnh lựa chọn hay xác định các nhân tố có tiềm năng ảnh hưởng đến quá trình ra quyết định. Các nhân tố này sẽ đưa đến quá trình thu thập dữ liệu - luôn luôn là một survey instrutment được đưa ra với các đơn vị kinh nghiệm , để thu thập thông tin phù hợp trong quá trình ra quyết định.
Transportation
Planning Example: An analyst is interested in modeling the mode choice
decision made by individuals in a region. The analyst reviews the
literature and develops the following list of potential factors
influencing the mode choice decision for most travelers in the region.
1. Trip maker characteristics (within the household context):
Vehicle
availability, possession of driver’s license, household structure
(stage of life-cycle), role in household, household income (value of
time)
2. Characteristics of the journey or activity:
Journey or activity purpose; work, grocery shopping, school, etc.,
time of day, accessibility and proximity of activity destination
3. Characteristics
of transport facility:Qualitative Factors; comfort and convenience,
reliability and regularity, protection, security
Quantitative
Factors; in-vehicle travel times, waiting and walking times,
out-of-pocket monetary costs, availability and cost of parking,
proximity/accessibility of transport mode
Estimate choice models
Qualitative
choice analysis methods are used to describe and/or predict discrete
choices of decision-makers or to classify a discrete outcome according
to a host of regressors. The need to model
choice and/or classification arises in transportation, energy,
marketing, telecommunications, and housing, to name but a few fields. There are, as always, a set of assumptions or requirements about the data that need to be satisfied. The response variable (choice or classification) must meet the following three criteria.
1. The set of choices or classifications must be finite.
2. The
set of choices or classifications must be mutually exclusive; that is, a
particular outcome can only be represented by one choice or
classification.
3. The
set of choices or classifications must be collectively exhaustive, that
is all choices or classifications must be represented by the choice set
or classification.
//Có 3 tiêu chuẩn yêu cầu đối với biến phụ thuộc khi sử dụng mô hình này. 1. Mẫu lựa chọn hay các nhóm lựa chọn phải giới hạn. 2. Các mẫu lựa chọn không giao nhau nói cách khác mỗi phương án lựa chọn được biểu thị một mẫu khác nhau. 3. Tất cả các lựa chọn phải được biểu diễn. Nếu như tiêu chuẩn 2 và 3 không phù hợp thì chúng ta có thể re-define ( định nghĩa lại) mẫu sao cho phù hợp.
Even when the 2nd and 3rd
criteria are not met, the analyst can usually re-define the set of
alternatives or classifications so that the criteria are satisfied.
Planning Example: An analyst wishing to model
mode choice for commute decisions defines the choice set as AUTO, BUS,
RAIL, WALK, and BIKE. The modeler observed a person in the database
drove her personal vehicle to the transit station and then took a bus,
violating the second criteria. To
remedy the modeling problem and similar problems that might arise, the
analyst introduces some new choices (or classifications) into the
modeling process: AUTO-BUS, AUTO-RAIL, WALK-BUS, WALK-RAIL, BIKE-BUS,
BIKE-RAIL. By introducing these new categories the analyst has made the discrete choice data comply with the stated modeling requirements.
Deriving Choice Models from Random Utility Theory
Choice
models are developed from economic theories of random utility, whereas
classification models (classifying crash type, for example) are
developed by minimizing classification errors with respect to the X’s
and classification levels Y. Because most of the literature in transportation
is focused on choice models and because mathematically choice models
and classification models are equivalent, the discussion here is based
on choice models. Several assumptions are made when deriving discrete
choice models from random utility theory:
1. An individual is faced with a finite set of choices from which only one can be chosen.
2. Individuals
belong to a homogenous population, act rationally, and possess perfect
information and always select the option that maximizes their net
personal utility.
3. If C is defined as the universal choice set of discrete alternatives, and J the number of elements in C, then each member of the population has some subset of C as his or her choice set. Most decision-makers, however, have some subset Cn, that is considerably smaller than C. It should be recognized that defining a subset Cn, that is the feasible choice set for an individual is not a trivial task; however, it is assumed that it can be determined.
4. Decision-makers are endowed with a subset of attributes xn Î X, all measured attributes relevant in the decision making process.
The
modeler, who is an OBSERVER of the system, does not possess complete
information about all elements considered important in the decision
making process by all individuals making a choice, so Utility is broken
down into 2 components, V and e:
Uin = (Vin + ein);
where;
Uin is the overall utility of choice i for individual n,
Vin is the systematic or measurably utility which is a function of xn and i for individual n and choice i
ein includes idiosyncrasies and taste
variations, combined with measurement or observations errors made by
modeler, and is the random utility component.
The error term allows for a couple of important cases: 1)
two persons with the same measured attributes and facing the same
choice set make different decisions; 2) some individuals do not select
the best alternative (from the modelers point of view it demonstrated
irrational behavior).
The decision maker n chooses the alternative from which he derives the greatest utility. In the binomial or two-alternative case, the decision-maker chooses alternative 1 if and only if:
U1n ³ U2n
or when:
V1n + e1n ³ V2n + e2n.
In probabilistic terms, the probability that alternative 1 is chosen is given by:
Pr (1) = Pr (U1 ³ U2)
= Pr (V1 + e1 ³ V2 + e2)
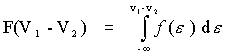
= Pr (e2 - e1 £ V1 - V2).
Note that this equation looks like a cumulative distribution function
for a probability density. That is, the probability of choosing
alternative 1 (in the binomial case) is equal to the probability that
the difference in random utility is less than or equal to the difference
in deterministic utility.
If
e = e2 -
e1,
which is the difference in unobserved utilities between alternatives 2
and 1 for travelers 1 through N (subscript not shown), then the
probability distribution or density of
e, ¦(e), can be specified to form specific classes of models.
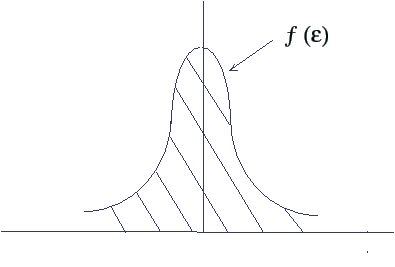 |
A couple of important observations about the probability density given by F (V1 - V2) can be made.
1. The error e is small when there are large differences in systematic utility between alternatives one and two.
2. Large
errors are likely when differences in utility are small, thus decision
makers are more likely to choose an alternative on the ‘wrong’ side of
the indifference line (V1 - V2 = 0).
Alternative 1 is chosen when V1 - V2 > 0 (or when e > 0), and alternative 2 is chosen when
V1 - V2 < 0.
Thus, for binomial models of discrete choice:
.
The cumulative distribution function, or CDF, typically looks like:
|
This structure for the error term is a general result for binomial choice models. By
making assumptions about the probability density of the residuals, the
modeler can choose between several different binomial choice model formulations. Two
types of binomial choice models are most common and found in practice:
the logit and the probit models. The logit model assumes a logistic distribution
of errors, and the probit model assumes a normal distributed errors.
These models, however, are not practical for cases when there are more
than two cases, and the probit model is not easy to estimate (mathematically) for more than 4 to 5 choices.
Mathematical Estimation of Choice Models
Recall
that choice models involve a response Y with various levels (a set of
choices or classification), and a set of X’s that reflect important
attributes of the choice decision or classification. Usually the choice
or classification of Y is a modeled as a linear function or combination
of the X’s. Maximum likelihood methods are employed to solve for the
betas in choice models.
Consider the likelihood of a sample of N independent observations with probabilities p1, p2,……,pn. The likelihood of the sample is simply the product of the individual likelihoods. The product is a maximum when the most likely set of p’s is used.
i.e. Likelihood L* = p1p2p3……pn =
For the binary choice model:
L* = (b1, ……, bK) =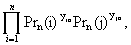
where, Prn
(i) is a function of the betas, and i and j are alternatives 1 and 2
respectively. It is generally mathematically simpler to analyze the
logarithm of L*, rather than the likelihood function itself. Using the fact that ln (z1z2) = ln (z1) + ln (z2), ln (z)x = x ln (z), Pr (j)=1-Pr (i), and yjn = 1 – yin, the equation becomes:
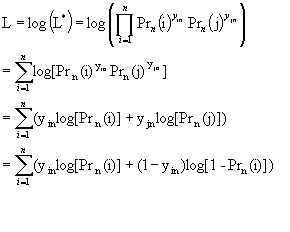 |
The maximum of L
is solved by differentiating the function with respect to each of the
beta’s and setting the partial derivatives equal to zero, or the values
of b1, ……, bK that provides the maximum of L . In many cases the log likelihood function is globally concave, so that if a solution to the first order conditions exist, they are unique. This does not always have to be the case, however. Under
general conditions the likelihood estimators can be shown to be
consistent, asymptotically efficient, and asymptotically normal.
In
more complex and realistic models, the likelihood function is evaluated
as before, but instead of estimating one parameter, there are many
parameters associated with X’s that must be estimated, and there are as
many equations as there are X’s to solve. In practice the probabilities
that maximize the likelihood function
are likely to be different across individuals (unlike the simplified
example above where all individuals had the same probability).
Because
the likelihood function is between 0 and 1, the log likelihood function
is negative. The maximum to the log-likelihood function, therefore, is
the smallest negative value of the log likelihood function given the data and specified probability functions.
Planning
Example. Suppose 10 individuals making travel choices between auto (A)
and transit (T) were observed. All travelers are assumed to possess
identical attributes (a really poor assumption), and so the
probabilities are not functions of betas but simply a function of p, the
probability of choosing Auto. The analyst also does not have any alternative specific attributes—a very naive model that doesn’t reflect reality. The likelihood function will be:
L* = px (1-p)n-x = p7 (1-p)3
where; p = probability that a traveler chooses A,
1-p = probability that a traveler chooses T,
n = number of travelers = 10
x = number of travelers choosing A.
Recall that the analyst is trying to estimate p, the probability that a traveler chooses A. If
7 travelers were observed taking A and 3 taking T, then it can be shown
that the maximum likelihood estimate of p is 0.7, or in other words,
the value of L* is maximized when p=0.7 and 1-p=0.3. All other combinations of p and 1-p result in lower values of L*. To see this, the analyst plots numerous values of L* for all integer values of P (T) from 0.0 to 10.0. The following plot is obtained:
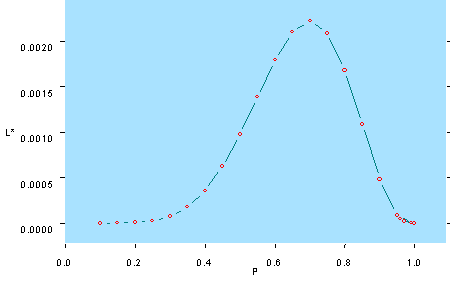 |
Similarly (and in practice), one could use the log likelihood function to derive the maximum likelihood estimates, where L = log (L*) = Log [p7 (1-p)3] = Log p7 + Log (1-p)3 = 7 Log p + 3 Log (1-p).
LogLikehood Function
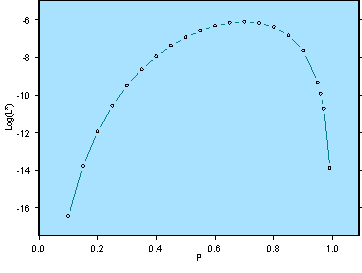 |
Note that in this simple model p is the only parameter being estimated, so maximizing the likelihood function L* or the log (L*) only requires one first order condition, the derivative of p with respect to log (L*).
The Multinomial Logit Model
The
multinomial logit (MNL) model is the most commonly applied model to
explain and forecast discrete choices due to its ease of estimation and
foundation in utility theory. The MNL model is a general extension of
the binomial choice model
to more than two alternatives. The universal choice set is C, which
contains j elements, and a subset of C for each individual Cn, defines
their restricted choice sets. It should be noted that it is not a
trivial task to define restricted choice sets for individuals. In most
cases Jn for decision maker n is less than or equal to J, the
total number of alternatives in the universal choice set, however it is
often assumed that all decision makers face the same set of universal
alternatives.
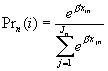
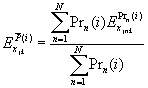
Without showing the derivation, which can be found in the references for this chapter, the MNL model is expressed as:
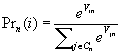
Where;
2. Pn (i) is the probability that traveler n chooses mode i
3. Numerator is utility for mode i for traveler n, denominator is the sum of utilities for all alternative modes Cn for traveler n
4. The disturbances ein are independently distributed
5. The disturbances ein are identically distributed
The MNL model
expresses the probability that a specific alternative is chosen is the
exponent of the utility of the chosen alternative divided by the
exponent of the sum of all alternatives (chosen and not chosen). The
predicted probabilities are bounded by zero and one. There are several
assumptions embedded in the estimation of MNL models.
Linear in parameters restriction:
The
linear in parameters restriction is made for convenience of estimation,
which enables simple and efficient estimation of parameters. When the
functional form of the systematic component of the utility function is
linear in parameters, the MNL model can be written as:
where xin and xjn are vectors describing the attributes of alternatives i and j as well as attributes of traveler n.
Independence from Irrelevant Alternatives Property (IIA)
Succinctly
stated, the IIA property states that for a specific individual the
ratio of the choice probabilities of any two alternatives is entirely
unaffected by the systematic utilities of any other alternatives. This property arises from the assumption in the derivation of the logit model that the error terms en across individuals are independent. In other words, it is assumed that un-observed attributes (error terms) of alternatives are independent. In many cases this is an unrealistic assumption, and creates some difficulties. For example, if driver n has an unobserved (error term) preference for public transit, then public transit mode error terms will not be independent.
Another
way to express IIA is that the ratio of choice probabilities of any two
alternatives for a specific individual is entirely unaffected by the
systematic utilities of any other alternatives.
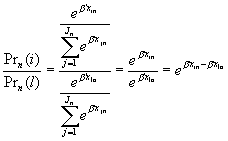 |
Note that the ratio of probabilities of modes i and j for individual n are unaffected by ‘irrelevant’ alternatives in Cn.
One
way to pose the IIA problem is to explain the red bus/blue bus paradox.
Assume that the initial choice probabilities for an individual are as
follows:
P (auto) = P (A) = 70%
P (blue bus) = P (BB) = 20%
P (rail) = P(R) = 10%
By the IIA assumption:
P (A)/P (BB) = 70 / 20 = 3.5, and
P(R)/P (BB) = 10 / 20 = .5.
Assume that a red bus is introduced with all the same attributes as
those of the blue bus (i.e. it is indistinguishable from blue bus except
for color, an unobserved attribute). So,
in order to retain constant ratio’s of alternatives (IIA), the original
share of blue bus probability, the following is obtained:
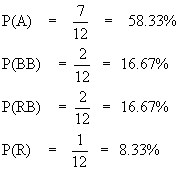 |
since
the probability of the red bus and blue bus must be equal, and the
total probability of all choices must sum to one. If one attempts an
alternate solution where the original ‘bus’ share is split between RB
and BB, and the correct ratios are retained, one obtains the same answer
as previously.
This is an unrealistic
forecast by the logit model, since the individual is forecast to use
buses more than before, and auto and rail less, despite the fact that a
new mode with new attributes has not been introduced. In
reality, one would not expect the probability of auto to decline,
because for traveler n a ‘new’ alternative has not been introduced. In estimating MNL models, the analyst must be cautious of cases similar to the red-bus/blue-bus problem, in which mode share should decrease by a factor for each of the ‘similar’ alternatives.
If one attempts an alternate solution where the original ‘bus’ share is
split between RB and BB, and the correct ratios are retained, one
obtains the same answer as previously.
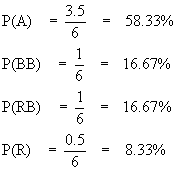 |
This
is an unrealistic forecast by the logit model, since the individual is
forecast to use buses more than before, and auto and rail less, despite
the fact that a new mode with new attributes has not been introduced. In
reality, one would not expect the probability of auto to decline,
because for traveler n a ‘new’ alternative has not been introduced. In estimating MNL models, the analyst must be cautious of cases similar to the red-bus/blue-bus problem, in which mode share should decrease by a factor for each of the ‘similar’ alternatives.
The IIA restriction does not apply to the population as a whole. That is, it does not restrict the shares of the population choosing any two alternatives to be unaffected by the utilities of other alternatives. The
key in understanding this distinction is that for homogenous market
segments IIA holds, but across market segments unobserved attributes
vary, and thus the IIA property does not hold for a population of individuals.
A MNL therefore is an appropriate model
if the systematic component of utility accounts for heterogeneity
across individuals. In general, models with many socio-economic
variables have a better chance of not violating IIA.
When
IIA does not hold, there are various methods that can be used to ‘get
around’ the problem, such as nested logit and probit models.
Elasticities of MNL
The analyst can use coefficients estimated in logit models to determine both disaggregate and aggregate elasticities, as well as cross-elasticities.
Disaggregate Direct Elasticities
An
example of dissaggregate direct elasticity is given by the following.
An analyst wants to know the effect of a unit change in the value of
some attribute on alternative mode utilities, or mode preferences for traveler n. The elasticity of traveler n for parameter k on alternative i is given by:
For
example, assume that individual 18 (an observation in observed data)
has an auto travel time of 51.0 minutes and transit travel time of 85.0
minutes. For this individual,
the probability of choosing auto is given by plugging auto travel time
and transit travel time into the MNL estimated on the sample of data:
This individual’s direct elasticity of auto travel time with respect to auto choice probability is calculated to obtain:
Thus
for an additional minute of travel time in the auto, there would be a
decrease of 0.39% in auto usage for this individual. Of course this is
the statistical result, which suggests that over repeated choice
occasions, the decision maker would use auto 1 time less in 100 per 3
minutes of additional travel time.
Disaggregate Cross-Elasticities
If the analyst was instead interested in the effect that travel time had on choosing mode j, say auto, where Pn (Auto) = .45, the analyst could simply set up a cross elasticity as follows:
which
suggests that the deterministic utility of the Auto for traveler n
increases by 22.5 given a unit increase of 1 minute of travel time to
the bus stop.
Aggregate Direct Elasticities
This
type of elasticity is simply the weighted average
of individual elasticities across some subgroup of individuals who chose
alternative i. This is useful for
predicting the change in the expected mode
share across the group who chose alternative i. The
elasticity is given by:
The
dis-aggregate elasticity is the probability that a subgroup will choose
mode i with respect to a unit or incremental change in variable k. For example, this could be used to predict the change in mode share for group of transit if transit fare increased by 1 unit.
The process of Estimating Multinomial Logit Models
Specification of the MNL requires several distinct steps to be taken by the analyst.
1. Identify the choice set, C of alternatives. This
will be different depending upon the geographical location, population,
socio-economic characteristics, attributes of the alternatives, and
factors that influence the choice context.
2. Identify the feasible choice subsets Cn
for individuals in the sample. Note that there are two choice sets; one
‘universal’ choice set C for the entire population, and choice sets Cn for individuals in the population. It
is important that choice sets do not include modes that are not
considered, and conversely, that all considered modes are represented.
In practice it can be difficult to forecast with restricted choice sets,
but the resulting model will be improved if restricted choice sets are known for individuals.
3. Next,
the analyst must identify which variables influence the decision
process, which characteristics of individuals are important in the
choice process, and how to measure and collect them.
4. Design
and administer a survey instrument (includes devising a sampling
scheme) to collect the necessary information (the topic of another
course), or observe/record the choice being made by individuals.
5. Finally, MNL models are estimated and refined to select the ‘best’ using all of the data gathered in previous steps.
Interpretation of MNL Model Results:
Estimation
of MNL models leads to fairly standard output from estimation programs.
In general program output can be obtained showing coefficient
estimates, model goodness of fit, elasticities, and various other
aspects of model fitting.
Model Coefficients
There are several rules to consider when interpreting the coefficients in the MNL model.
1. Alternative
specific constants can only be included in MNL models for n-1
alternatives. Characteristics of decision-makers, such as socio-economic
variables, must be entered as alternative specific. Characteristics of
the alternative decisions themselves, such as costs of different
choices, can be entered in MNL models as “generic” or as alternative
specific.
2. Variable coefficients only have meaning in relation to each other, i.e., there is no ‘absolute’ interpretation of coefficients. In other words, the absolute magnitude of coefficients is not interpretable like it is in ordinary least squares regression models.
3. Alternative
Specific Constants, like regression, allow some flexibility in the
estimation process and generally should be left in the model, even if
they are not significant.
4. Like model
coefficients in regression, the probability statements made in relation
to t-statistics are conditional. For example, most computer programs
provide t-statistics that provide the probability that the data were
observed given that true coefficient value is zero. This is different
than the probability that the coefficient is zero, given the data.
Planning Example: A binary logit model was estimated on data
from Washington, D.C. (see Ben-Akiva and Lerman, 1985). The following
table (adapted from Ben-Akiva et. al.) shows the model results,
specifically coefficient estimates, asymptotic standard errors, and the
asymptotic t-statistic. These t-statistics represent the t-value (which
corresponds to some probability) that the true model parameter is equal to zero. Recall that the critical values of for a two-tailed test are ± 1.65 and ± 1.96 for the 0.90 and 0.95 confidence levels respectively.
Variable Name Coef. Estimate Standard Error t statistic
Auto Constant 1.45 0.393 3.70
In-vehicle time (min) -0.00897 0.0063 -1.42
Out-of-vehicle time (min) -0.0308 0.0106 -2.90
Out of pocket cost* -0.0115 0.00262 -4.39
Transit fare ** -0.00708 0.00378 -1.87
Auto ownership* 0.770 0.213 3.16
Downtown workplace* -0.561 0.306 -1.84
(indicator variable)
* auto specific variable; **transit specific variable
Inspection
of the estimation results suggests that all else being equal, the auto
is the preferred alternative, since the alternative specific constant
for auto is positive. Note that only one alternative specific constant
is entered in the model. Also, all but one of the variables is
statistically significant at the 10% level of significance.
The model
shows that for an additional minute of in-vehicle travel time, the
utility of that mode decreases. Since the variable is entered as
“generic”, it reflects the effect of in vehicle travel time in either
transit or auto. It might be believed that travelers do not have the
same response to travel time by mode, and so this variable could be
entered as alternative specific.
The model
shows that out-of-vehicle time, entered as “generic”, is by a factor of
about 3 more influential on utility than is in-vehicle time.
The model
shows that travelers are sensitive to travel costs; utility for transit
decreases as transit fare increases, and utility for auto decreases as
out-of-pocket costs increase. Notice that auto riders are approximately
doubly sensitive to travel costs as are transit riders.
Owning
a vehicle provides greater utility for taking auto, as one would
expect. Working in the downtown actually reduces the utility of the
auto—presumably the downtown is easily accessed via transit, and the
impedance to downtown via auto is great. Although part of the impedance
may partly be cost and travel time, which has already been captured,
there may be additional impedance due to availability and cost of
parking, safety, and other factors.
Refine models
Assess Goodness of Fit
There are several goodness of fit measures available for testing ‘how’ well a MNL model fits the data on which it was estimated.
The likelihood ratio test is a generic test that can be used to compare models with different levels of complexity. Let L (b¢) be the maximum log likelihood attained with the estimated parameter vector b¢, on which no constraints have been imposed. Let (b¢c) be the maximum log likelihood attained with constraints applied to a subset of coefficients in b¢. Then, asymptotically (i.e. for large samples) -2(L (b¢c)-L (b¢)) has a chi-square distribution with degrees of freedom
equaling the number of constrained coefficients. Thus the above
statistic, called the “likelihood ratio”, can be used to test the null
hypothesis that two different models perform approximately the same (in
explaining the data). If there is insufficient evidence to support the
more complex model, then the simpler model is preferred. For large
differences in log likelihood there is evidence to support preferring
the more complex model to the simpler one.
In
the context of discrete choice analysis, two standard tests are often
provided. The first test compares a model estimated with all variables
suspected of influencing the choice process to a model that has no
coefficients whatsoever—a model that predicts equal probability for all choices. The test statistic is given by:
-2(L (0) - L (b¢)) » c2 , df = total number of coefficients
The null hypothesis, H0
is that all coefficients are equal to 0, or, all alternatives are
equally likely to be chosen. L (0) is the log likelihood computed when
all coefficients including alternative specific constants are
constrained to be zero, and L (b¢) is the log likelihood computed with no constraints on the model.
A
second test compares a complex model with another naïve model, however
this model contains alternative specific constants for n-1 alternatives.
This naïve model is a model
that predicts choice probabilities based on the observed market shares
of the respective alternatives. The test statistics is given by:
-2(L(C) - L (b¢)) » c2 , df = total number of coefficients
The null hypothesis, H0
is that coefficients are zero except the alternative specific
constants. L(C) is the log likelihood value computed when all slope
coefficients are constrained to be equal to zero except alternative
specific constants.
In general the analyst
can conduct specification tests to compare ‘full’ models versus reduced
models using the chi-square test as follows:
-2(L (F) - L(R)) » c2 , df = total number of restrictions, = KF - KR
In logit models there is a statistic similar to R-Squared in regression called the Pseudo Coefficient of Determination. The Psuedo coefficient of determination is meant to convey similar information
as does R-Squared in regression—the larger is r2 the larger the proportion of log-likelihood ‘explained’ by the parameterized model.
The rc2 statistic is the r2 statistic corrected for the number of parameters estimated, and is given by:
Planning Example Continued: Consider again the binary logit model estimated on Washington, D.C., data. The summary statistics for the model are provided below (adapted from Ben-Akiva and Lerman, 1985).
Summary Statistics for Washington D.C. Binary Logit Model
number of model parameters = 7
L (0) = - 1023
L (b) = -374.4
-2[L (0) – L (b)] = 1371.7
c2 (7, 0.95) = 14.07
r = 0.660
rc = 0.654
The summary statistics
show the log likelihood values for the naïve model with zero
parameters, and the value for the model with the seven parameters
discussed previously. Clearly, the model
with seven parameters has a larger log likelihood than the naïve model,
and in fact the likelihood ratio test suggests that this difference is
statistically significant. The r and rc suggest that about 65% of the log likelihood is “explained” by the seven parameter model. This interpretation of r should be used loosely, as this interpretation is not strictly correct. A more useful application of rc would be to compare it to a competing model estimated on the same data. This would provide one piece of objective criterion for comparing alternative models.
Variables Selection
There are asymptotic t-statistics that are evaluated similarly to t-statistics in regression save for the restriction on sample sizes. That is to say that as the sample size
grows the sampling distribution of estimated parameters approaches the
t-distribution. Thus, variables entered into the logit model can be
evaluated statistically using t-statistics and jointly using the log
likelihood ratio test (see goodness of fit). Of course variables should
be selected a priori based upon their theoretical or material role in the decision process being modeled.
Tests of Non-Linear Specifications
As in classical regression, there may be times when a linear specification is an inappropriate one. Thus, there are a couple of approaches to employ: a piece-wise linear approach, and/or variable transformations and/or power expansions. Overall model tests can be conducted to determine if the additional variables or variable transformation offers an improvement.
Test of Taste Variations
Choice theory is essentially a dis-aggregate modeling approach. Specifically, it states that individuals have utility functions that include attributes of alternatives and of individuals. However, the current model has fixed parameter estimates, that is, all individuals are expected to respond (linearly) to the same coefficients. This might not be an altogether reasonable assumption, however, since individuals may have different parameter values, or even utility functions themselves.
There are two methods employed to get around this problem. The first is to treat the socio-economic variables differently that enter into the models. The
second is to introduce what is called a random coefficients logit
model, which is technically difficult and computationally burdensome. In addition, for forecasting purposes it is not that useful to have random coefficients in a model.
Market segmentation allows for different Beta values across market segments. In this approach G market segments are defined, and a vector of parameters for each of the G market segments is estimated. Then, the null hypothesis that: b1 = b2 =b3 =……= bG is tested using the fact that:
Are choice model assumptions met?
Identically and independently distributed errors
If
the IIA assumption does not hold, there are alternative methods for
estimating choice models. To determine if alternative models are
necessary, there are some useful tests to determine if IIA is violated.
Since
the ratio of choice probabilities between two modes is expected to
remain unchanged relative to ‘other’ choices, other choices could
feasibly be added to the ‘choice set’ and the original choice
probability ratios should remain unchanged.
A
test proposed by Hausman and McFadden (1984) incorporates the use of a
test conducted between the restricted choice set model (r), which is the
model estimated without one of the choice alternatives, and a full model (f), estimated on the full set of alternatives.
If IIA is not violated, then the coefficient estimates should only be affected by random fluctuation caused by statistical sampling.
The test statistic q=[bu - br]¢ [Vu - Vr] [bu - br] is asymptotically chi-square distributed with Kr degrees of freedom, where Kr is the number of coefficients in the restricted choice set model, bu and br are the coefficient vectors estimated for the unrestricted and restricted choice sets respectively, and Vu and Vr are the variance-covariance matrices for the unrestricted and restricted choice sets respectively. This test can be found in textbooks on discrete choice and some software programs.
Uncorrelated errors
Correlated
errors occur when either unobserved attributes of choices are shared
across alternatives (the IIA assumption), or when panel data are used
and choices are correlated over time. Violation of the IIA assumption
has been dealt with in a previous section. Panel data need to be handled with more sophisticated methods incorporating both cross-sectional and panel data.
Outlier Analysis
Similar to regression, the analyst should perform outlier analysis. In doing so, the analyst should inspect the predicted choice probabilities with the chosen alternative. An
outlier can arbitrarily be defined as a case where a decision was
chosen even though it only had a 1 in 100 chance of being selected. When these cases are identified, the analyst looks for miscoding and measurement errors made on variables.
If an observation is influential, but is not erroneous, then the analyst must search for ways to investigate. One way is to estimate the model without the observation included, and then again without the observation.
Alternative choice model specifications
When the IIA property of MNL is violated, the modeler should consider alternative specifications. Recall
that IIA is violated when alternatives share unobserved attributes.
When there are shared unobserved components associated with different
choices or alternatives, the utilities of the elements of the
corresponding multidimensional choice set cannot be independent. There
are two common strategies of dealing with violations of the IIA
assumption in the MNL model—nested logit and multi-nomial probit models.
Nested logit
One may think of a multi-dimensional choice context as one with inherent structure, or hierarchy. This notion helps the analyst to visualize the nested logit model, although the nested logit model
is not inherently a hierarchical model. Consider the case of four
travel alternatives, auto, bus with walk access, bus with auto access,
and carpool. This might be
thought of as a nested choice structure, the first decision is made
between public transit and auto, and then between which alternative
given that public or private has been selected. Mathematically, this
nested structure allows subsets of alternatives to share unobserved
components of utility, which is a strict violation of the IIA property
in the MNL model. For example,
if transit alternatives are nested together, then it is feasible that
these alternatives shared unobserved utility components such as comfort,
ride quality, safety, and other attributes of transit that were omitted
from the systematic utility functions. This ‘work-around’ solution to
the IIA assumption in MNL model
is a feasible and relatively easy solution. In a nutshell, the analyst
groups alternatives that share unobserved attributes at different levels
of a nest, so as to allow error
terms within a nest to be correlated. For more detailed discussions on
nested logit models consult the references in listed in this chapter.
Multi-nomial probit
Multinomial
probit is an extension of probit models to more than two alternatives.
Unfortunately, they are difficult to estimate for more than 4 or 5
alternatives due to the mathematical complexity of the likelihood function
as the number of alternatives increases. As computers become faster
and/or computational methods become improved, multinomial probit models
may be used to estimate models for reasonable sized choice sets.
External validation of model
Prediction Tests
Like in regression, perhaps the most powerful test of any model comes from the use of external ‘validation’ data. External data can test that the model does not over-fit the estimation data, and can also be used to assess the generalizeability of model
results across space and time. To externally validate a model, new data
are collected and used to assess the predictive ability of the model. It is important to understand that MNL models are difficult to interpret for individual predictions or decisions, so validation should be consistent with the true interpretation of the model, that is, the Prn
(i) is a long-term notion of probability, and therefore could best be
validated preferably over panels of observations on individuals or
through observations on ‘apparently’ homogenous groups of individuals.
Conduct Statistical Inference, Document Model, and Implement
The
modeler is now ready to conduct statistical inference, document the
model, and implement. Statistical inference is the process by which
inferences are made about the population, or process being modeled,
based on the model estimated on the sample of data. Statistical inference is the cornerstone of statistical theory and allows the modeler to make statements about the population.
There are several estimated parameters that are used to make inferences about the population, the betas, which represent the mean change in Y (choice probability) given a unit change in the X’s, and Yhat, which reflects the mean response given a combination of X values.
The interpretation of a confidence interval is very explicit and should be treated with caution. A 1- a confidence interval on b1 indicates that the true value of b1 will fall within the confidence limits given repeated samples taken on the same X levels a times out of 100. Recall that b1 is the mean change in the mean of the distribution in Y with a unit change in x.
One-sided versus Two-sided Hypothesis Testing
The confidence interval given by b1 +- t {1 - a / 2; n - 2} s [b1] is a two-sided confidence interval. This means that the analyst is concerned with how probable events are on either side of the true parameter b1. Often, the engineer wants to ask the question “does some confidence interval of b1 contain the value 0?” The alternative hypotheses then are:
H0: b1 = 0, and Ha: b1 ¹ 0.
If the confidence interval for a given confidence level 1 - a (i.e. 1 - .05 = .95) does not contain 0, then one can conclude that at that confidence level, a*100 times out of 100 when repeat samples are drawn at the same x levels the confidence interval will not contain 0.
The analyst could alternatively test whether b1 is positive. In this case the test hypotheses are:
H0: b1 £ 0, and Ha: b1 > 0.
In this case one side of the distribution is considered such that all the error is assigned to one side of the probability distribution.
Model Documentation
Once
a model has been estimated and selected to be the best among competing
models it needs to be thoroughly documented, so that others may learn
from the modeler’s efforts. It is important to recognize that a model
that performs below expectations is still a model
worth reporting. This is because the accumulation of knowledge is based
on objective reporting of findings—and only presenting success stories
is not objective reporting. It is just as valuable to learn that certain
variables don’t appear effectual on a certain response than vice versa.
When reporting the results of models, enough
information should be provided so that another researcher could
replicate your results. Not reporting things like sample sizes, manipulations to the data, estimated variance, etc., could render follow-on studies difficult.
Perhaps
the most important aspect of model documentation is the theory behind
the model. That is, all the variables in the model should be accompanied
by a material explanation for being there. Why are the X’s important in
their influence on Y? What is the mechanism by which X influences Y?
Would one suspect an underlying causal relation, or is the relationship
merely associative? These are the types of questions that should be
answered in the documentation accompanying a modeling effort. In
addition, the model equations, the t-statistics, R-square, MSE, and
F-ratio tests results should be reported. Thorough model documentation will allow for future enhancements to an existing model.
Model Implementation
Model implementation, of course, should have been considered early on in the planning stages of any research investigation. There are a number of considerations to take into account during implementation stages:
1) Are the variables needed to run the model easily accessible?
2) Is the model going to be used within the domain with which it was intended?
3) Has the model been validated?
4) Will the passage of time render model predictions invalid?
5) Will transferring the model to another geographical location jeopardize model accuracy?
These
questions and other carefully targeted questions about the particular
phenomenon under study will aid in an efficient and scientifically sound
implementation plan.
How is a choice model equation interpreted?
A MNL model equation represents the association
between a dependent variable Y, which represents the probability of a
particular choice being made, and one or more independent variables
(X’s) that reflect attributes of the choices and the choice-maker.
Unlike the linear regression model, the coefficients in choice models
are multiplicative on the response. The model parameters, or partial
slope coefficients, represent the change in Y given a unit change in X,
all else held constant. If the model was estimated using experimental
data, then the parameters may represent the change in Y caused by a unit
change in a particular X. If the model was estimated using quasi-experimental or observational data, then the regression
parameters represent the change in Y associated with a unit change in a
particular X, and do not necessarily represent causal effects.
The choice model equation is meant to model as accurately as possible the relationships in the true population, in as simple an equation as is possible. The regression model is known a priori not to capture all the structure in the real data, and is known to be wrong to some degree. The model
represents a convenient way to explain relationships or predict future
events given known inputs, or value of the independent variables (X’s).
How do continuous and indicator variables differ in the choice model?
Continuous variables are usually interval or ratio scale variables, whereas indicator variables are usually nominal or ordinal scale variables. Indicator variables can be entered in the choice model or can be interacted with a continuous variable
and effect the slope coefficient of the interacted variable. Indicator
variables are somewhat analogous to testing the difference in means
between two groups as in ANOVA. Indicator variables in the choice model
can only take on one of two values— 0 or 1.
How are beta coefficients interpreted?
The betas in a logit model are called the model coefficients. The coefficient with the variable X1, b1, indicates the change in the mean
of the probability distribution of Y, the probability that a choice is
made, per unit increase in the multiplicative exponent of X1. Thus, the interpretation is not straightforward as is the interpretation for linear regression.
How is the Likelihood Ratio Test interpreted?
The likelihood ratio test is similar to the F test in regression. Under the null hypothesis that all coefficients are zero (or some other null hypothesis that represents a restricted model), that is b1 = b2 = …. = bK = 0, the test statistic –2{L (0) – L (b)} is c2 distributed with K degrees of freedom.
Often
a more useful test compares a model with alternative specific constants
in the model only, instead of a model with all coefficients equal to
zero. Alternatively, the analyst can compare any full model with a
restricted model using the likelihood ratio test.
A
large value of the likelihood ratio test statistic provides evidence
against the restricted model. For a likelihood ratio observed at an
alpha of 5%, the likelihood ratio test statistic as large as the one observed would be obtained in 5 samples in 100.
How are t-statistics interpreted?
A t-statistic is similar to a likelihood ratio test, except the test is for a single variable
in the model. The standard t-test provided by most standard statistical
software packages is used to determine the probability that an
individual variable’s parameter is equal to zero. In actuality the test
is conditional on the variable’s parameter equaling zero, and provides the probability of the data having arisen under this constraint.
In
the theory of discrete choice models t-tests are not exact results, and
are instead asymptotic results. This implies that as the sample size approaches infinity, the estimated model coefficients are distributed as t.
How are phi and adjusted phi interpreted?
Phi, or the likelihood ratio index, is analogous to R2
in linear regression. An adjusted phi, compensating for models with
different numbers of explanatory variables, adjusts for the fact that
phi can only increase or stays the same with additional explanatory
variables. In general, the larger is phi, the greater is the explanatory
power of the model.
How are confidence intervals interpreted?
A confidence interval
is interpreted as follows: If samples were repeatedly drawn at the same
X-levels as were drawn in the original sample, then alpha (a) times out of 100 the mean of the sample Y’s will fall within the (1-a)% confidence interval. In simpler but less technically correct terms, the analyst is (1-a)% confident that the mean of a new sample
falls in the confidence interval. Confidence intervals might be
constructed around parameter values in discrete choice models using
asymptotic t-distribution results. In this case, the analyst will make
inferences about values of the true model parameters, which are
estimated by the model coefficients.
How are degrees of freedom interpreted?
Degrees of freedom are associated with sample size. Every time a statistical parameter is estimated on a sample of data the ability to computer additional parameters decreases. Degrees of freedom are the number of independent data points used to estimate a particular parameter.
How are elasticities computed and interpreted?
An
elasticity is the change in some response due to an independent
variable. For instance an analyst may want to know the effect of a unit
change in the value of some attribute, say travel time, on alternative
mode utilities, or mode preferences for traveler n.
When is the independence of irrelevant alternatives (IIA) assumption violated?
Succinctly
stated, the IIA property states that for a specific individual the
ratio of the choice probabilities of any two alternatives is entirely
unaffected by the systematic utilities of any other alternatives. This property arises from the assumption in the derivation of the logit model that the error terms en across individuals are independent. In other words, it is assumed that un-observed attributes (error terms) of alternatives are independent. In many cases this is an unrealistic assumption, and creates some difficulties. For example, if driver n has an unobserved (error term) preference for public transit, then public transit mode error terms will not be independent.
Should interaction terms be included in the model?
Interactions
represent synergistic effects of two or more variables. Interaction
terms represent potentially real relationships embedded in data. Most
often they arise in quasi-experimental and observational data. An interaction that is important should be included in the model, despite the fact that it might not contribute much to model
explanatory power. In general, third and higher order interactions
(that are real in the population) can be ignored without much detriment
to the model.
How many variables should be included in the model?
The objective of most modeling efforts is to economize the model, since it is known a priori that
the great complexity underlying the data cannot be modeled exactly. In
other words, the analyst generally wishes to explain as much of the data
complexity with as few variables as practicable. Generally seven
variables plus or minus two variables covers most models, although
smaller and larger models can be found. It is generally better to favor a
simpler model to a more complex one, simply because interpretation and
implementation are simplified also. On the other hand, if the phenomenon
is sufficiently complex, then making too simple a model may sacrifice too much explanatory or predictive power.
What methods can be used to specify the relation between choice and the X’s?
Unlike linear regression, which represents a linear relation between a continuous variable
and one or more independent variables, it is difficult to develop a
useful plot between explanatory variables and the response used in
discrete choice models. An exception to this occurs when repeated
observations are made on an individual, or data are grouped (aggregate).
For instance, a plot of proportion choosing alternative A by group (or
individual across repeat observations) may reveal some differences
across experimental groups (or individuals).
What methods are available for fixing heteroscedastic errors?
Heteroscedasticity
in discrete choice models is a violation of the IIA property. It occurs
when there are shared unobserved components associated with different
choice dimensions. The most common procedure for dealing with heteroscedasticity is by employing the nested logit model.
What methods are used for fixing serially correlated errors?
Serially
correlated errors occur when observations are taken over time. The
primary reason is that there are unobserved attributes that affect the
decision process for an individual over time, such as built in biases,
experiences, etc. These kinds of data, often referred to as panel or
time-series data, represent more complicated models of choice behavior.
Consult Greene for additional details on dealing with serially
correlated data in discrete choice models.
What can be done to deal with multi-collinearity?
Multi-collinearity
is when two variables co-vary, and is commonly found in
non-experimental data. It is not a violation of choice models
explicitly, however it does cause problems in the mathematics of solving
for the regression parameters. In essence, highly collinear variables
(e.g. a correlation
coefficient of 0.7 or higher) cause regression parameters to be
inefficient (high standard errors), and can cause the signs of the regression coefficients to be counter-intuitive.
There are few remedies to the multi-collinearity
problem. First, highly correlated variables can be left in the model
and assumed to reflect the natural state of those variables in reality.
In this case the analyst must rely on the collinearity being
ever-present in future observed data. A
second option is to remove the less important of the two collinear
variables and keep only one in the model. This is usually the preferred
option. A third option is to employ a biased estimation technique such
as ridge regression to opt for more biased but precise estimates, which are not influenced by the presence of multicollinearity.
What is endogeneity and how can it be fixed?
Endogeneity is fancy term for having an independent variable that is directly influenced by the dependent variable Y. It is presumed a priori that all independent variables are exogenous—that they are determined by influences outside of the modeling system. When a particular X is endogenous, the model errors are correlated with the variable, and problems in the regression
occur, such as biased estimates, etc. Some remedies include the use of
instrumental variables approaches, proxy variables, and structural
equations models.
How does one know if the errors are Gumbel distributed?
The Gumbel distribution is the assumed distribution of the MNL and nested logit models. The Gumbel distribution has two parameters, a scale parameter h and a location parameter, m. It is conveniently assumed in MNL and nested logit models that the scale parameter is equal to 1, since it is not directly estimable.
Unlike linear regression, it is not easy to determine if model
errors are Gumbel distributed. In the case or grouped (aggregate) or
repeated individual observation data, an analyst could plot the
distribution of errors by computing the choice probabilities and
comparing them to observed proportions of choices. However, this is
often impractical, and due to the lack of alternative distributional
forms offered in discrete choice models, is often not performed.
0 comments:
Post a Comment